Introduction
You may have noticed over the last year that we have some new performance data available, including Excess Trip Time. Our ability to use these improved performance metrics is in large part thanks to behind-the-scenes changes to how the data is collected and stored. This blog post gives a glimpse into the technology that enables OPMI and other departments at the T to perform analytics on the services we operate, and measure how the service we provide compares to our goals. This post was written in collaboration with the Technology Innovation Department (TID), one of the MBTA teams that OPMI works with closely.
Assessing the Performance of MBTA Service
As the MBTA strives to continue improving the performance of our transit system, we need to be able to measure and understand how our service has performed historically. We need to answer questions like: How often are vehicles on time? How long do riders have to wait between vehicle arrivals? How often do vehicles leave a stop early or late?
Answering these kinds of questions requires a lot of data, and the tooling to access those data needs to be scalable, efficient, and widely accessible. Our Lightweight Application for Measuring Performance, better known as LAMP, is a data platform developed by TID that enables the ingestion, storage, and analysis of service performance data in a rapid, reliable, efficient, and scalable way.
Why was LAMP Built?
Before LAMP, analyzing historical MBTA performance data was challenging. The ability to store historical service data wasn’t keeping pace with our improvements to real-time data. Costly and inflexible legacy systems were hard-coded to use old metrics based on vendor-specific data, and those metrics didn’t reflect a clear understanding of “good” service or inform specific problems.
Fast forward to now: LAMP, built in-house by TID data engineers intimately familiar with MBTA data, continuously stores the latest real-time data, uses a flexible architecture that can adapt to current and future performance metrics, supplies data to downstream users and systems, and empowers analysts inside and outside of the MBTA to answer questions about service performance.
What Exactly is LAMP?
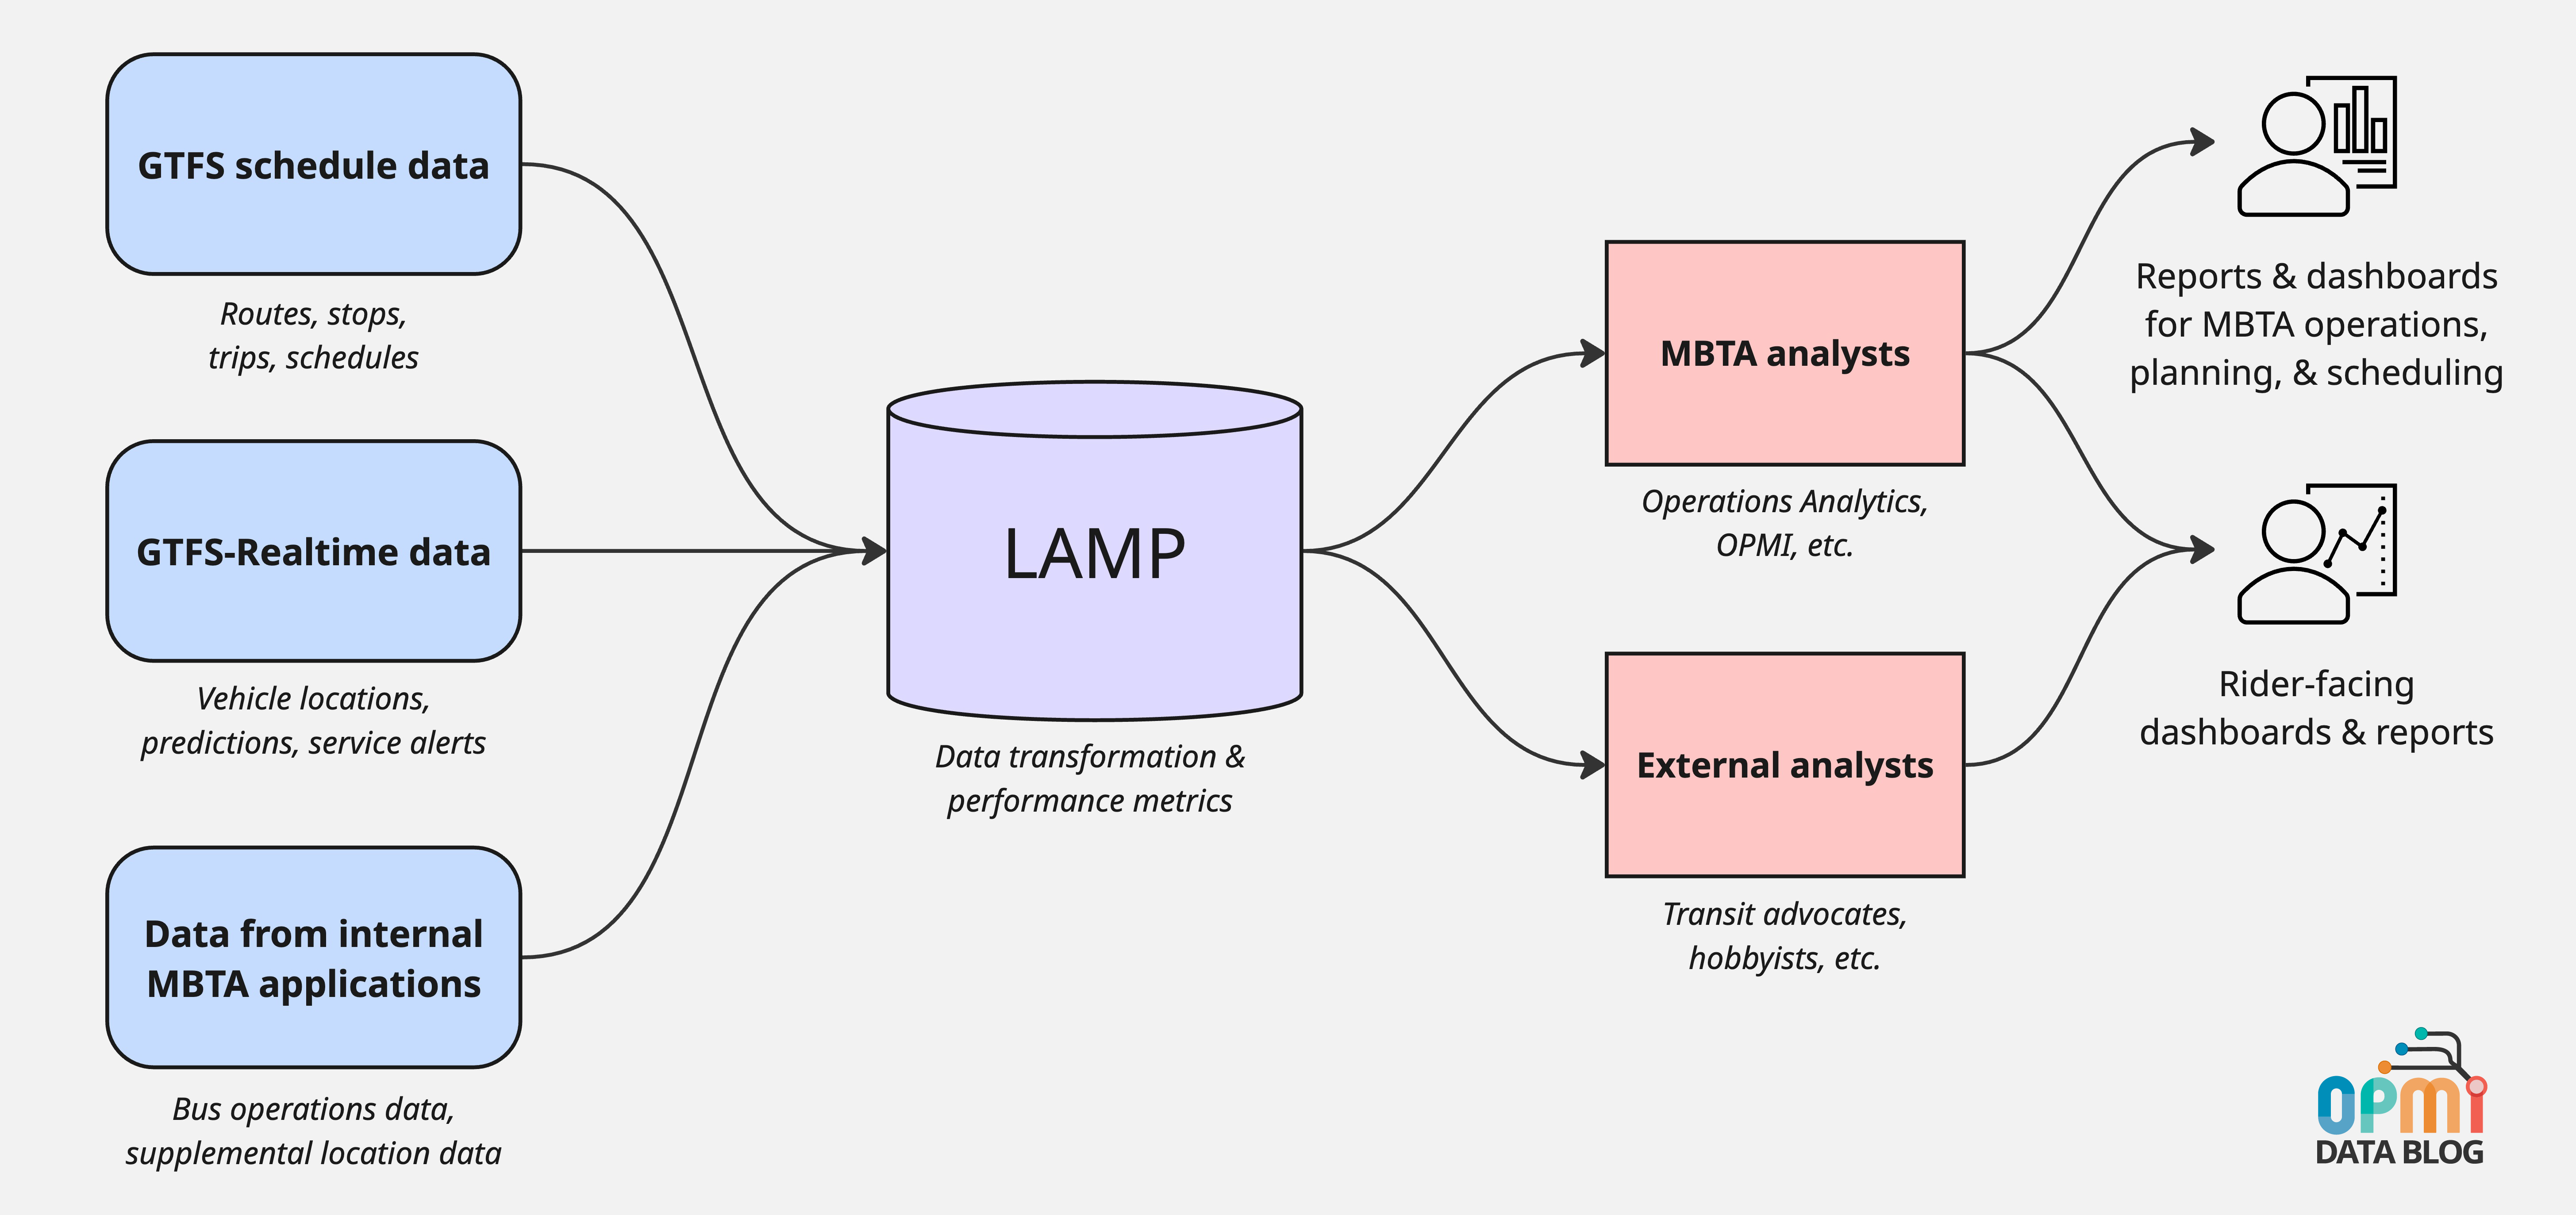
LAMP is a suite of Python applications that run on Amazon Web Services (AWS) infrastructure. LAMP’s ingestion applications continuously retrieve data from upstream sources, transform them in a variety of ways, and store them in Parquet files. Parquet is a format that allows for portability, accessibility, compatibility, and significant compression, which enables storage efficiency and cost savings.
LAMP stores and publishes MBTA schedule data (think routes, trips, and stops) and real-time data (think vehicle locations, arrival and departure predictions, and service alerts) that build on the industry-standard General Transit Feed Specification (GTFS) and GTFS-Realtime specification, respectively.
LAMP also transforms raw data into performance-specific metrics for both our rail and bus systems and stores them for analysis. LAMP’s Subway Performance Manager data were publicly published in May 2024, and similar data for Bus Performance Manager will be published in the coming months.
Who Uses LAMP?
LAMP has quickly become a critical source of data for MBTA analysts. The Operations Analytics team uses LAMP to create internal dashboards and reports that analyze metrics like run times, departure times, and daily and weekly service levels by line. They use LAMP to track how delivered service compares to scheduled service and pinpoint patterns of operational performance issues that warrant consideration for a host of possible improvements.
OPMI uses LAMP to feed data to public dashboards showing key rider metrics like service reliability and accessibility. This information helps hold the MBTA accountable to its Service Delivery Policy and discloses service metrics to the public.
We're proud of our commitment to transparency, and LAMP is another way we fulfill that commitment: by publishing our performance data for anyone to view and use how they see fit. LAMP data are being used by advocacy organizations like TransitMatters, who created their own performance dashboards to hold the MBTA accountable, push for more favorable transit policies, and educate riders and the general public.
LAMP is also used by hobbyists and other individuals who simply want to analyze or visualize MBTA data. Anyone can explore dashboards fueled by LAMP, or download LAMP data at the source. Want to see the data yourself? Visit performancedata.mbta.com.
What's Next for LAMP?
LAMP was built so it could grow with the MBTA. It already stores many performance metrics, and will support more data in the future. We’re entering the final phase of getting our Bus Performance Manager data out into the world. After that, we’ll add new data like records of bus detours and other service adjustments that dispatchers deploy to try keep operations on track over the course of a day. Let us know what other data you are interested in seeing in LAMP!
Conclusion
Built by our own team in a flexible and scalable way, LAMP helps illuminate the MBTA’s historical service performance for internal and external stakeholders, as well as the general public, so that together we can guide and shape the future. We’re confident that as we continue to add data to LAMP, we’ll find interesting new connections and uncover opportunities to improve service. Stay tuned for more!